
Java Memory Overview
Java manages memory automatically, using a Garbage Collector (GC) to reclaim memory. Memory is split into heap and non-heap areas, each serving different purposes and managed differently.
Heap Structure Insights
The heap is subdivided into generations: Young, Old, and (optionally) Permanent. Young generation is for new objects. Old houses objects that have survived garbage collection. Permanent (or Metaspace) holds class metadata.
Garbage Collection Deep Dive
Java uses several GC algorithms: Serial, Parallel, CMS, G1, and ZGC. Each has its trade-offs, affecting throughput and pause times differently. Understanding their differences is crucial for performance tuning.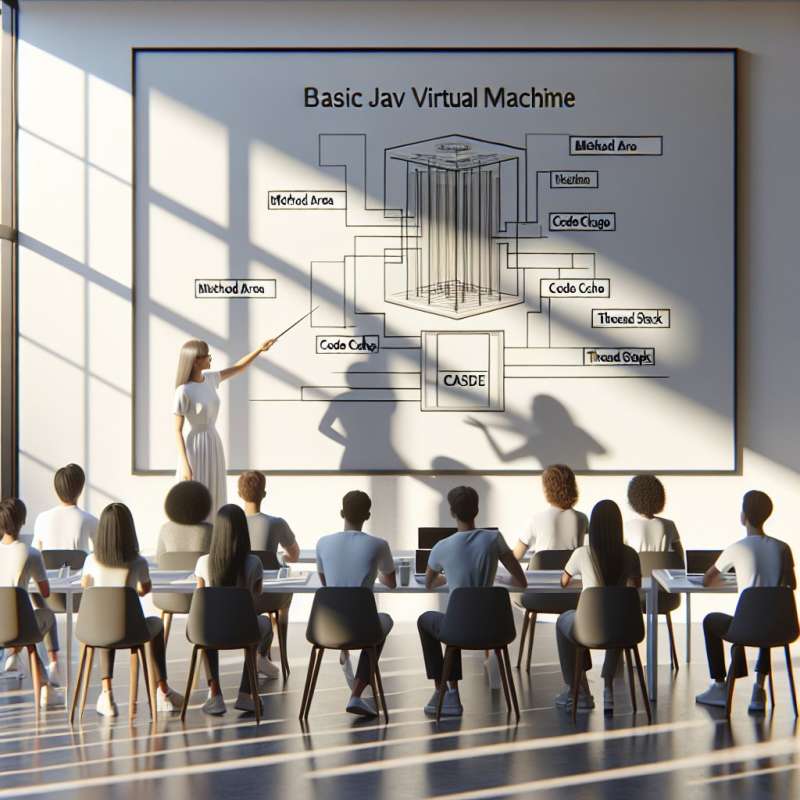
Non-Heap Areas Explained
Non-heap memory includes the Method Area, where the class structure is stored, and Code Cache, holding compiled code. The JVM also uses memory for thread stacks, which is not part of the heap or non-heap areas.
Memory Leaks Uncovered
Despite automatic memory management, Java applications can still suffer from memory leaks. Common causes include static collections that grow indefinitely, listeners not being removed, or caches without size limits.
GC Tuning Techniques
Tuning GC involves adjusting heap size, selecting the appropriate collector, and setting generation sizes. Profiling memory usage can guide these decisions to optimize application performance.
Advanced Garbage Collectors
Newer GCs like ZGC and Shenandoah aim for low-latency by operating concurrently with the application threads. They represent cutting-edge efforts to minimize pause times in large heap scenarios.
What does Java's Garbage Collector primarily manage?
Heap and non-heap memory areas
CPU utilization and management
External resource allocation
Company